How to create an Embedded Map
This page will show you how to create a cutting-edge HelloDrifter webGL map that can be embedded on your website or shared with a link for full-screen interaction.
Prerequisites
Before you create an Embedded Map, there must be a Route or Race course that you can use as a source for the Embedded Map. The best option is usually to create a Race, as it provides more features and allows you to embed multiple courses on a single map. The alternative is to create a Route. Either approach works and both share similar steps to create a courses.
What it is
An Embedded Map differs from the course pages of a Race or a Route in that it is simply a method of presenting a course publicly: It gives you detailed control of the features and styles to display for your course.
If you have already made your course (and you should have!), the hard work is already done. Creating an Embedded Map consists of filling out a single form specifying the features and styles the map should display.
First step
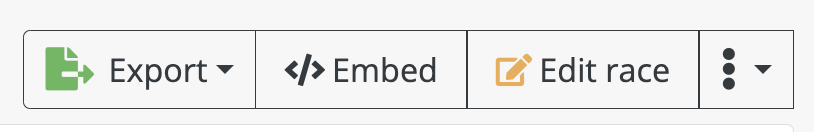
The easiest way to start creating an Embedded Map is from the course page that you want to use as the source for the embedded map. Both a Race and a Route page will show an “Embed” (ensure you are logged in!):
On a Route page, you will be redirected to the Embedded Map form with your Route pre-selected as the source of the map. However, clicking the button on Race pages will pop up a modal asking whether you want to embed a specific Race on the Event or whether you want to embed the entire Event. See the below example for an Event with 17 and 35 mile races:
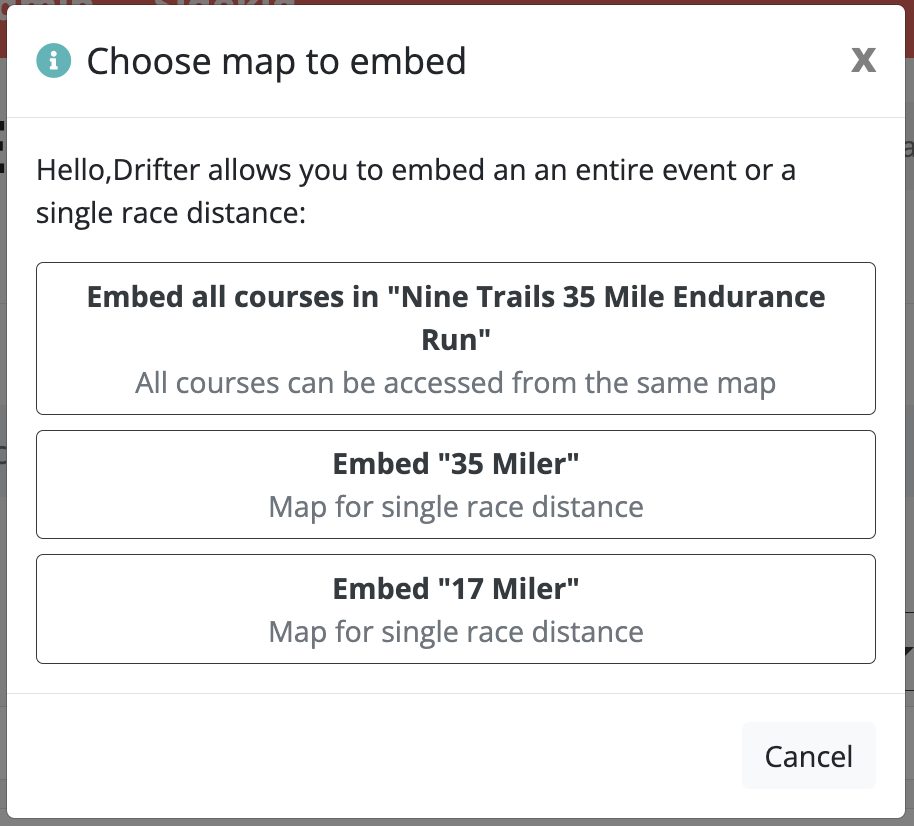
If you have multiple Races and which for users to be able to toggle between them on a single map, select the “Embed all courses” option. Whichever option you select, you will be redirected to the Embedded Map page with the course (or courses) pre-selected.
The Embedded Map Form
You should see a form that looks something like this:
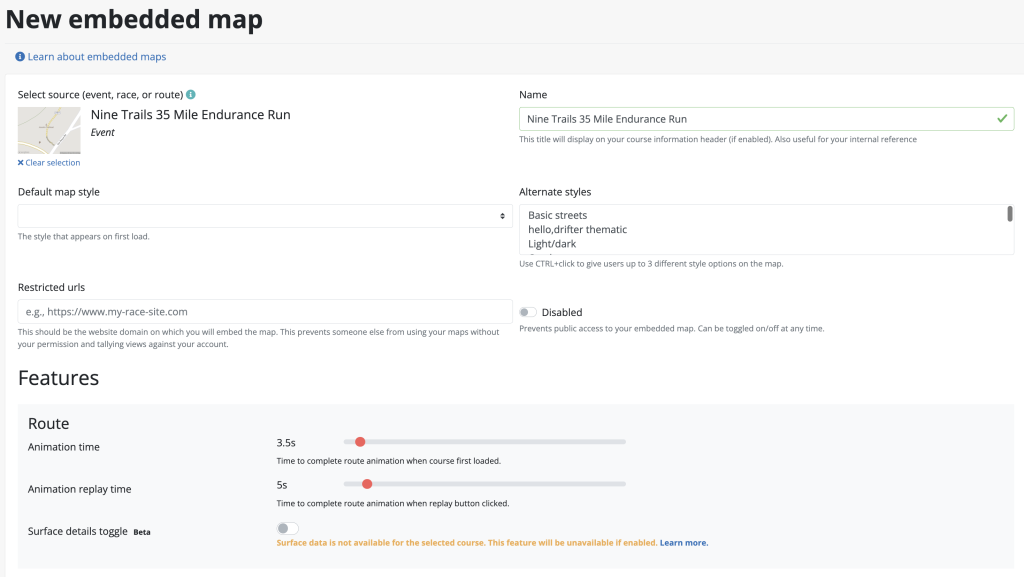
This is a relatively long form, but there are only a few required fields. So even if you are unsure of something, you should have little trouble creating an Embedded Map. We’ll also go through each option and feature to help understand them.
Select source [required]
This is a required field and should be filled out for you if you followed the instructions above. If not, this should be a text field from which you can search for either Routes, Races, or entire Events by toggling the “Search” dropdown just to the right of the text field. (Remember, if you embed an entire Event of Races, your map can toggle between each race distance.)
Name [required]
This is also required but should be pre-populated with the course name. This field is only relevant in that it can help you to identify a particular Embedded Map (say, to edit it), and (2) this name will be displayed at the top of the Embedded Map if the “header” feature is enabled (discussed below).
We recommend you keep the name as short as possible. Long names can cause display issues on some screen sizes.
Default map style [required]
This is the map style – “the look and feel” such as tiles design, course color, and points of interest shape – that will appear when your embedded map first loads. This field allows you to select one of several pre-populated styles that we have provided. You can edit these styles or create your own as well, on another page.
We recommend either the Outdoor preset or the Satellite preset. But you can easily experiment and change your choice if you don’t like it.
Alternate styles [optional]
If you would like your users to be able to switch between styes, select one or more options here.
Restricted urls [optional but recommended]
If you intend to embed a map on your website, add the full URL (e.g., https://www.my-site.com) here.
Disabled
Leave this alone for now. You can enable this toggle at some point in the future if you want to temporarily deactivate an embedded map and thus prevent anyone from viewing it.
Embedded Map Features
We have now gone through all the core fields for an Embedded Map. Now we can explore the fun features!
Route features
The first block of features concerns the drawing of the course.
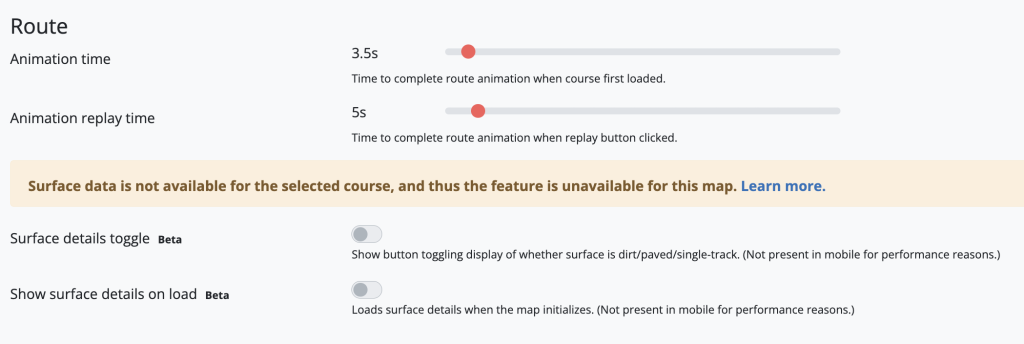
Animation time. This is the number of seconds for the course animation to complete when the map first loads. This feature is extremely helpful in understanding the direction and flow of a course. Different courses call for different animation times. We recommend anywhere from 3 to 15 seconds.
Animation replay time. Same as the above, but applied when a user has already loaded the map and requests to see the animation again. We recommend choosing a slightly longer value than the animation time value.
Surface details toggle. Surface details is an awesome feature that shows surface information for various parts of the course. Unfortunately, it is only available in select countries and even then is often unavailable for courses in remote areas, which tend not be fully documented in OpenStreetMap. If the feature is available for your course, turning this feature on will allow users to switch this feature on and off.
Show surface details on load. Enable if you want surface details to show when the map first loads. Just like the above toggle option, this is only enabled if the course you have selected has surface details.
Map features
There are a number of features pertaining to the underlying map.
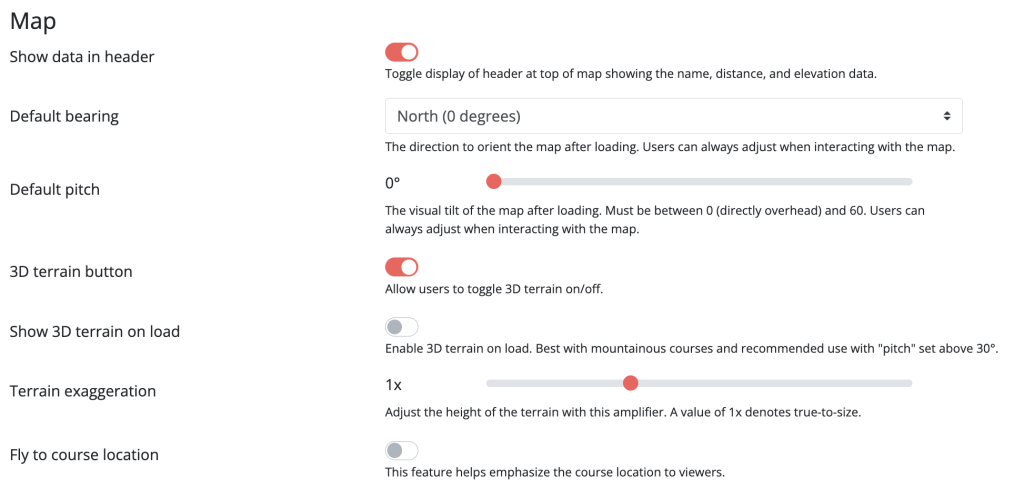
Show data in header. This toggles whether to show the information header at the top of the map. Useful if you want to show your users the calculated distance and elevation gain.
Default bearing. This is the direction that you want the top of the map to face. This is always worth considering as some courses present better when viewed in a certain direction.
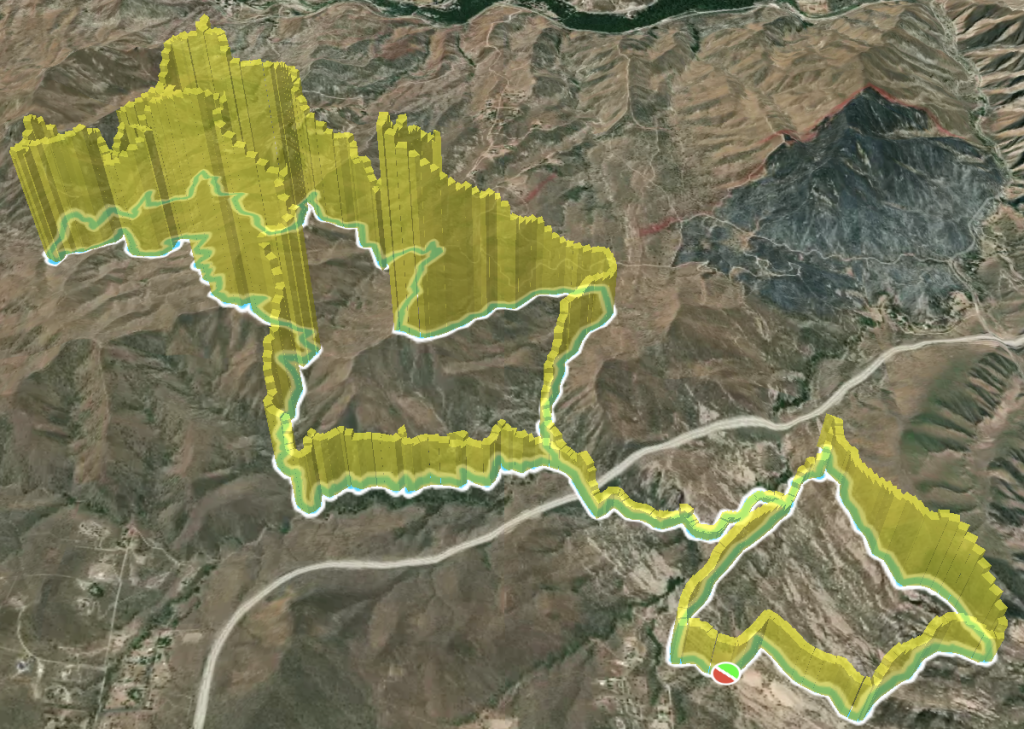
Default pitch. This is the “tilt” of the map. We recommend changing this to something like 30 or 40 degrees if the “Show 3D terrain on load” feature is enabled on a mountainous course to showcase the terrain.
3D terrain button. Whether to have a button on the map allowing users to toggle 3D terrain.
Show 3D terrain on load. Whether to show 3D terrain features when the map first loads.
Terrain exaggeration. By default, the 3D terrain will be proportionate to the zoom of the map. Some courses span a long distance, which can mute the impact of the terrain features. Increasing this value helps offset that.
Fly to course location. If disabled, the map will load at the location of the course. If disabled, the map will begin with an aerial view of Earth and fly to the location of your course. This is helpful in emphasizing the location of your course to users.
Map load guard
This feature prevents the map from loading unless a user tries to interact with the map. It does this by first loading a preliminary screen that must be clicked in some manner before the map loads. This saves you from unnecessary map usage that can get billed to your account.
Enable. Like it sounds, whether to enable or disable this feature.
Choose type. HelloDrifter gives you multiple display options to prevent a map from being loaded. The “standard” option is just a generic, inconspicuous black-and-white terrain image with a button to click. A “static map” is a cartoonish static representation of your course that must be clicked to load the interactive version. The “custom image” allows you to upload your own image to serve in the place of the map. This is useful if you have a particularly stylish website and want your own content to serve as a display.
Points of interest
There are two options in this section.
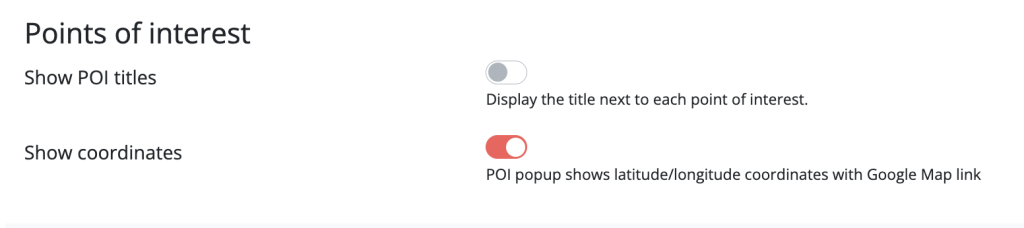
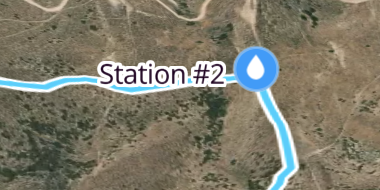
Show POI titles. This is whether to show POI titles on the map, as shown in the picture below. If enabled, you can of course still click on a POI to reveal its title and other information.
Show coordinates. When you click on a POI, a pop appears showing details you added about that POI, such as title, notes, etc. By default, we also add a small link displaying the POI’s GPS coordinates. Clicking on the link will take you to a Google maps page. This toggle allows you to enable or disable this feature.
Course selection
This feature concerns switching courses and is only available if the source for your Embedded map is an Event (i.e., multiple Races). The default for this is a dropdown select. The alternative provides a button, which pops up a modal to select a different course.
Distance markers
Distance markers indicate mile or kilometer intervals along the course. They are toggled on/off with a button.
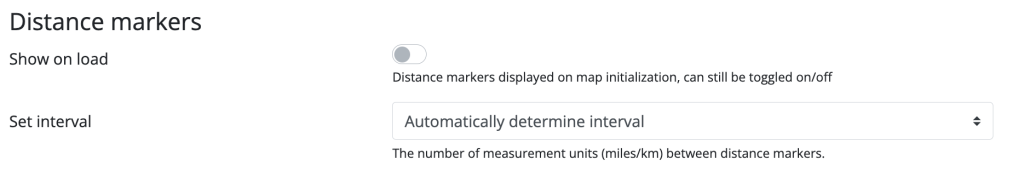
Show on load. Whether they should show by default.
Set interval. By default, HelloDrifter will determine the “best” interval to use. This depends on the length of the course. Usually it is either an interval of “1” or “5”, but long courses can exceed this. However, you can use this setting to adjust this and just use your own interval.
Course export
HelloDrifter allows users to download a GPX of the course directly from the map. You can remove that button by toggling this feature.
3D Elevation
HelloDrifter is the only mapping platform we know of to allow you to project the elevation chart onto the map.
Sometimes this feature works out great, and must be showcased. Other times, the elevation is not impressive and it might be best to disable this feature. There are two options here.
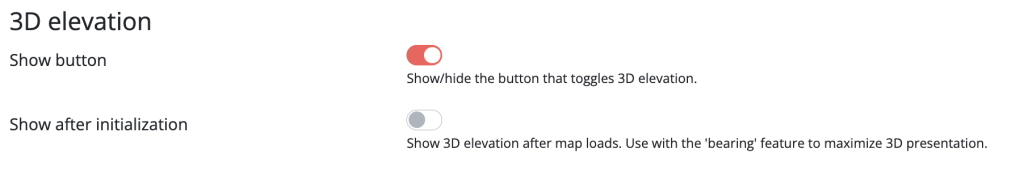
Show button. If you are not impressed with how the 3D elevation project looks on your map, disable this toggle.
Show after initialization. If your course really takes off with this feature enabled, show it after the map loads by enabling this. (Users can disable it so long as the “show button” feature is enabled above.)
Elevation chart
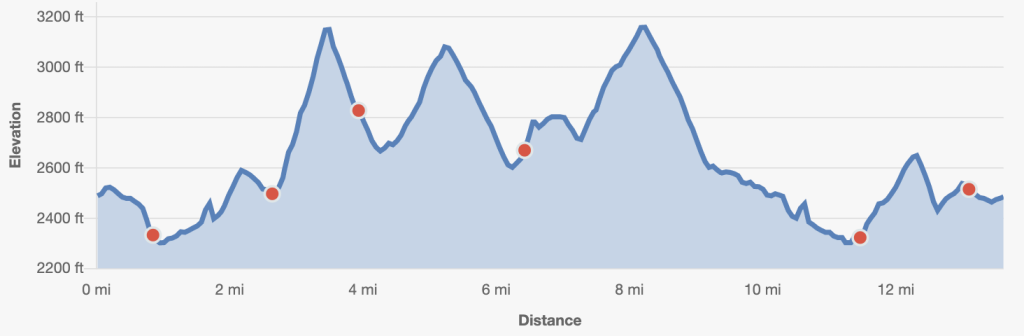
These features concern the elevation chart at the bottom of the map.
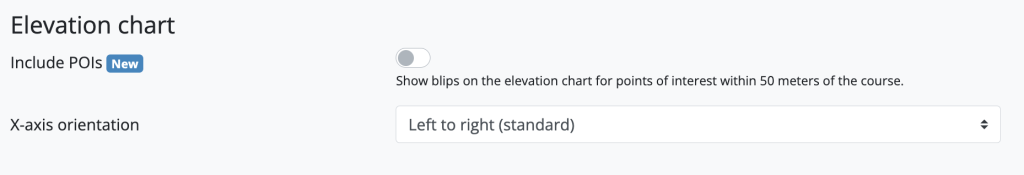
Include POIs. When enabled, points of interest that are sufficiently close to the course line (within 50 meters) will show up as “blips” on the elevation chart. The color used is based on the default color of points of interest, defined in the map style used. Hovering over the blips shows the title and any other data entered for the POI.
X-axis orientation. Toggle whether you want the elevation chart to read left-to-right (default) and right-to-left. Some of our users like to use the “right-to-left” when a course runs East-to-West, so that the elevation chart tends to track the direction of the course.
Finishing up
All done? Click “Save map” at the bottom of the page. You’ll be redirected to a details page for that Embedded Map. From here, you can preview it, see the number of times it has been viewed by the public, etc. Most importantly, you can get an embed code with a publicly available URL to access the map from you website.
Click the blue “Embed & share” button to pop up a modal where you can copy the unique URL.
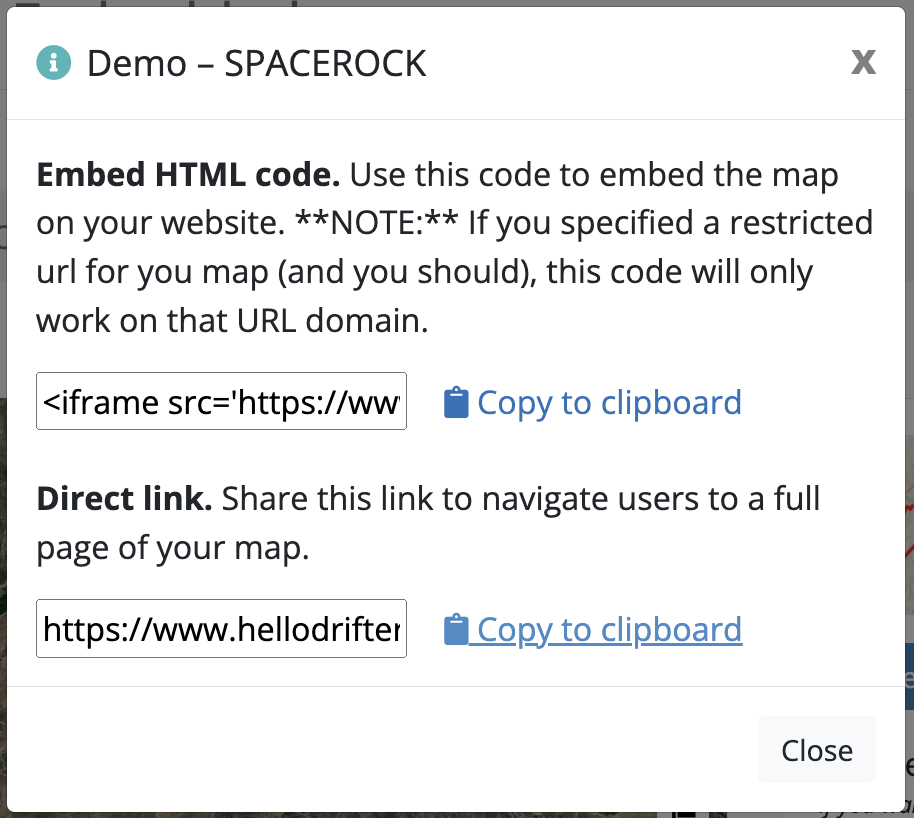
The link won’t work until you are a Pro subscriber. But once you have signed up, you can now embed your map into your website or share the link with the public. If you are having issues getting the size of the map right, see our FAQ here.
Doing it again: Using map templates
Often times you’ll want to use the same set of features and styles for a variety of maps. HelloDrifter allows you to create a “Map Template” from one of your existing Embedded Maps that can be quickly applied to any new and existing Embedded Maps.
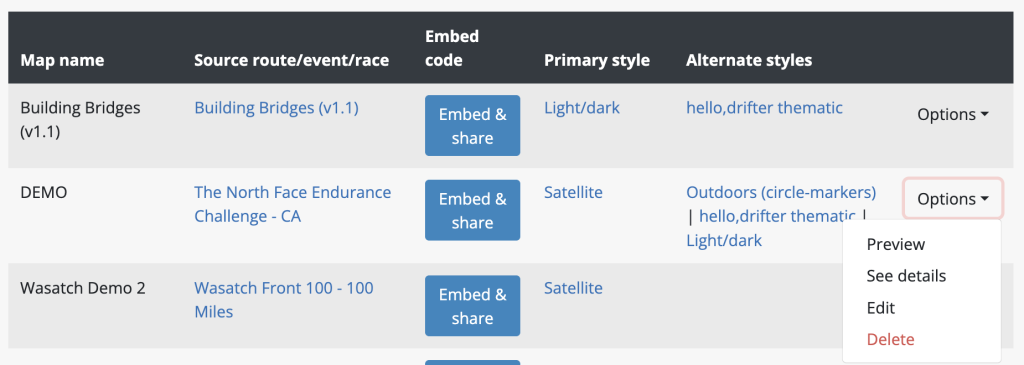
To create a Map Template, go to an existing Embedded Map details page. From the Embedded Map index page, find the Embedded Map with the features and styles that you want to use for a Map Template, go to the “Options” dropdown button and click “See details”:
On the details page, find the “Save as template” button on the right side of the page. This will cause a modal to pop up, with a field for the Map Template’s name. Enter a name and click “Submit”. You should see the page reload and a success message. Great, you’ve created a Map Template!
Now, let’s apply a Map Template to an Embedded Map. Either create a new or edit an existing Embedded Map to reach the Embedded Map form page, discussed at length above. (The process is the same whether you are creating a new Embedded Map or editing an existing one.) On the Embedded Map form, find the “Apply map template (optional)” button. This will be near the top. A modal will pop up, providing a select box for you to choose from your existing Map Templates. Select one and click the “Apply” button. The Embedded Map form will be immediately updated with all the attributes from the Map Template you created. You can accept the values as is, or freely edit the form. The changes you made (including those from applying the Map Template) will not be saved until you click the “Save map” button at the bottom of the form.