How to create a Race course
This page will discuss how to create Race courses on HelloDrifter. As always, if you struggle with any of the steps here, you can always reach out to us by email or message us on our contact page. We can take care of you quickly.
Advantages of creating Races
Why choose to create a Race rather than a Route? Both provide a way to generate a course map that you can publicly share. But Races have several advantages over Routes:
- Races all must belong to an Event. But you can have multiple Races belonging to the same Event, allowing you to group courses together.
- Creating a Race gives you the option to create an Embedded Map from a either single Race or from the entire Event. So, when you are ready to share your courses publicly (say, on your website), using an entire Event as your source allows the map switch between the courses.
- If you are a race director, you can claim your race and edit additional settings for the event page, such as manually setting elevation data or adding surface details to the map.
- Events are publicly searchable on our event index, allowing your races to be discovered by people looking for their next race. Learn more about our searching capabilities here.
- Races allow you to provide race-specific details to points of interest, such as cutoff times, drop bag information, pacer information, etc.
Getting started: create an Event
To begin creating an Event, sign into your HelloDrifter account and click the Races menu from the top menu bar. Then click the Create Event menu item that appears. Your browser will then load the Event creation page, which asks for some basic information.
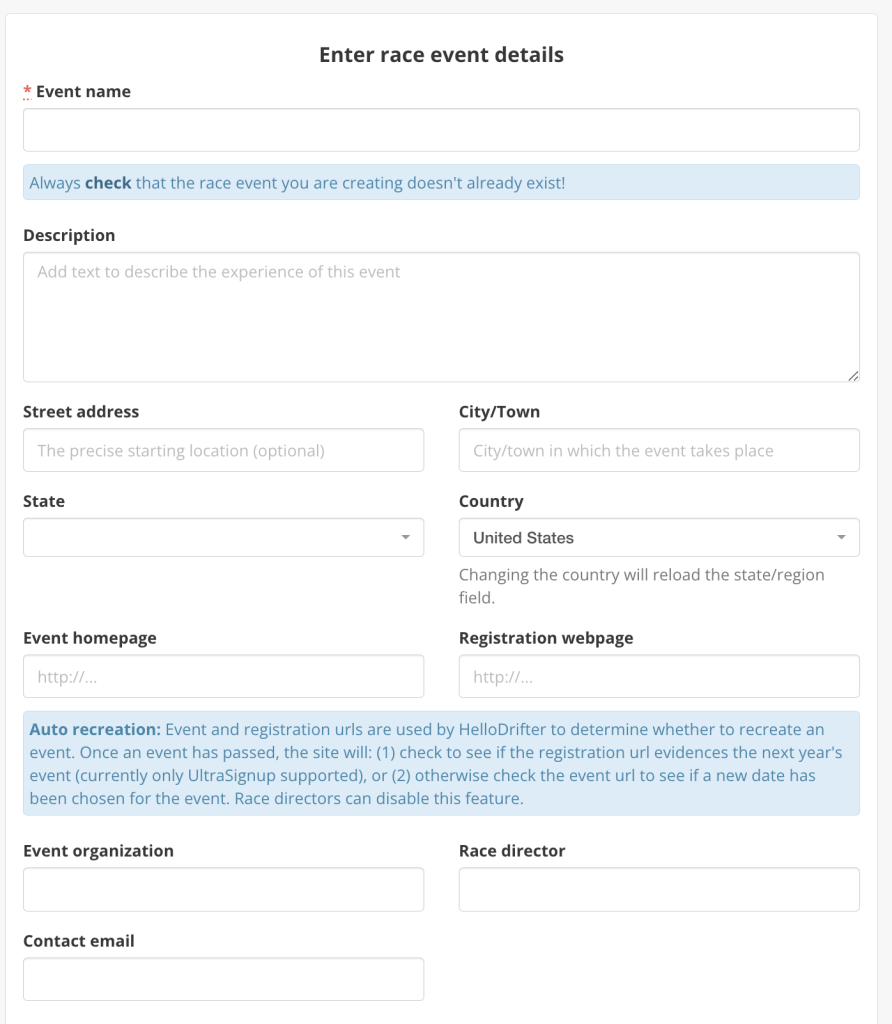
The only required field here is the name of your Event. The description, address, and other similar contact is helpful for those who may come across your Event page when searching our event index. We also recommend you fill out your homepage and registration URL. Not only is this very helpful for prospective participants who search HelloDrifter, providing your website lets us know if we should recreate your event the next time it comes around so we can keep our search index up-to-date.
The next set of fields requires that your provide some basic information about at least one of the race distances for your event. You must enter all the information here.
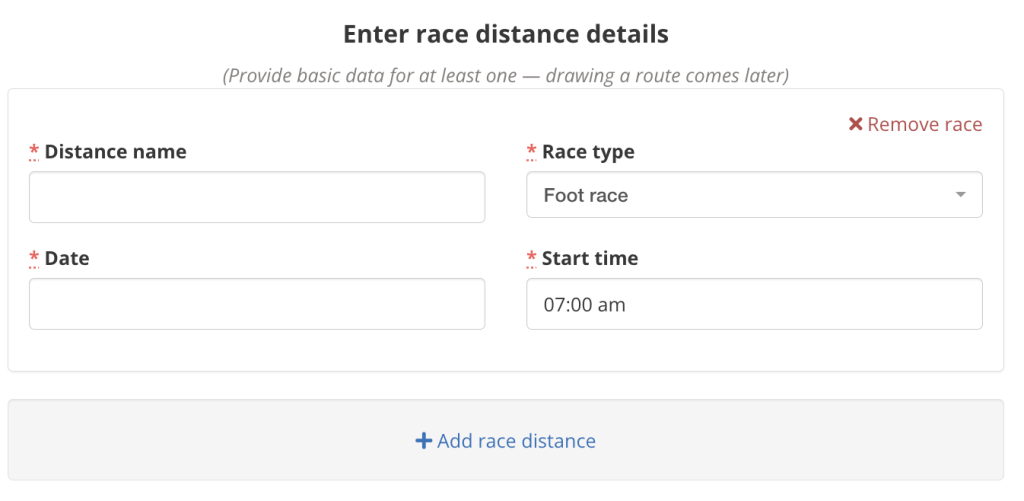
You can add the basic information for all your races now, or later. But you must add one!
When you are all set, click the “Continue” button at the bottom.
Plotting race courses
Once you have provided some basic Event details, you should see a page something like this:
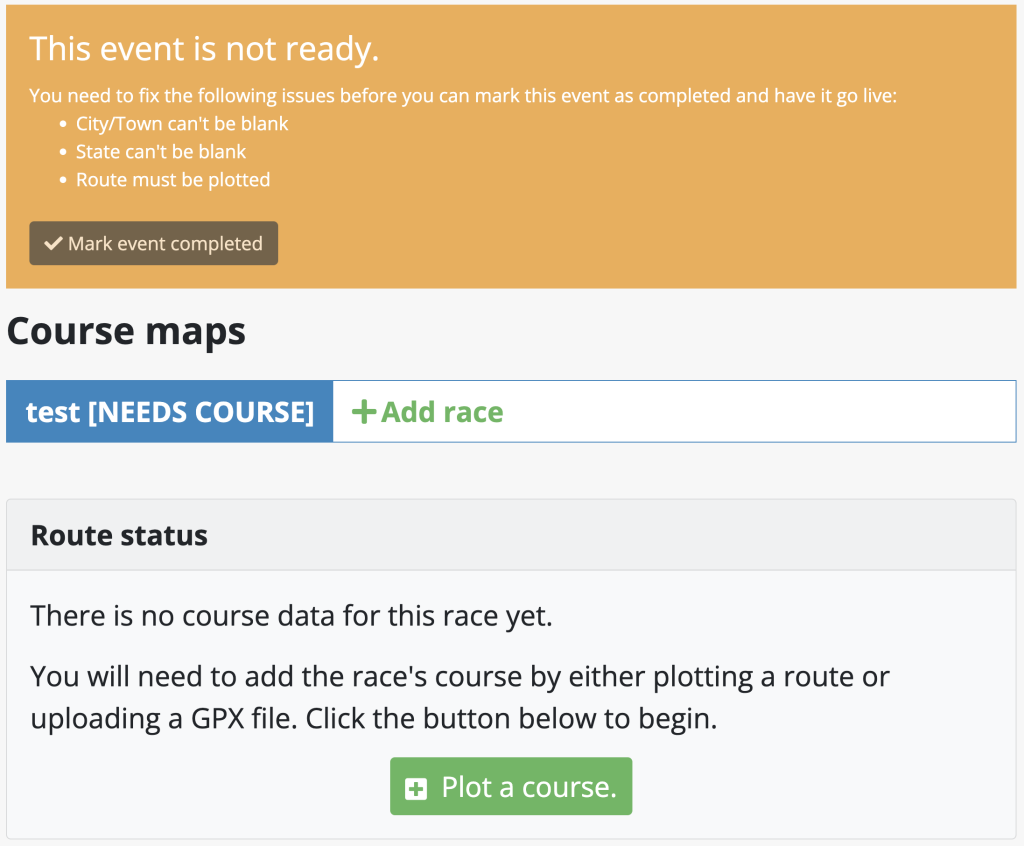
The page makes clear that your Event is not completed, as it needs course information. (The picture above also complains about city and state being blank, but you can ignore this as it will auto-populate once we have a course.) You should also see some of the basic event information you entered on the right side. You can always go back and edit any of your event details with the appropriate “Edit” button in the top-right.
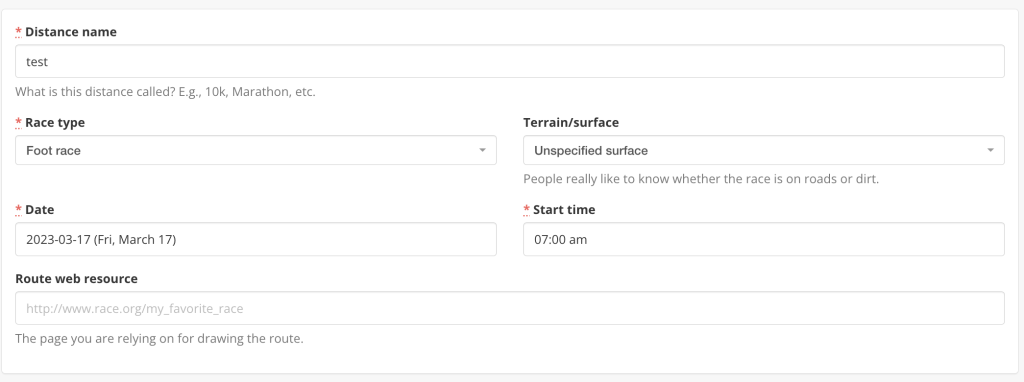
Let’s go ahead and start to plot our course. Click the green “Plot a course” button. That will bring us to a page that begins with some of the race fields we just entered on the last page (in case you want to change them). There is an additional field asking for the surface terrain (i.e., road or trail). Feel free to select the right value to provide additional information for folks who , but it isn’t required.
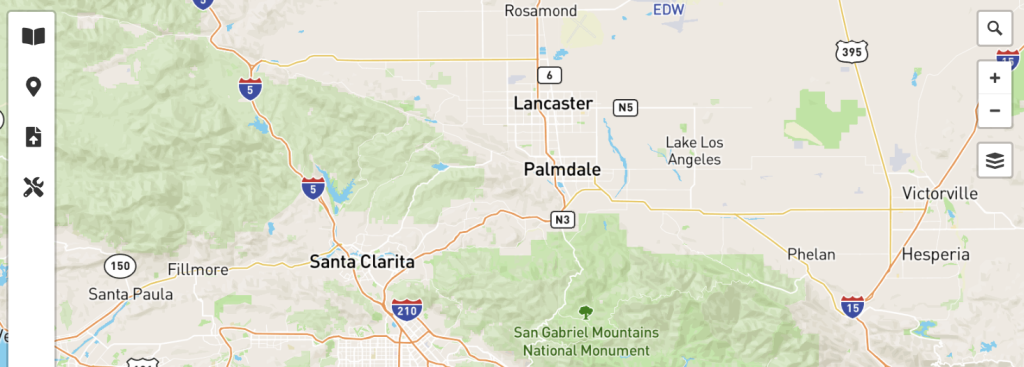
Scroll down and you’ll come to where the actual course is plotted:
If your browser asked you permission to provide your location information, the map should display the general area you live. We’ll next go through the various buttons on the map and show you how to make use of them to build your course.
Introduction to the toolbars and buttons
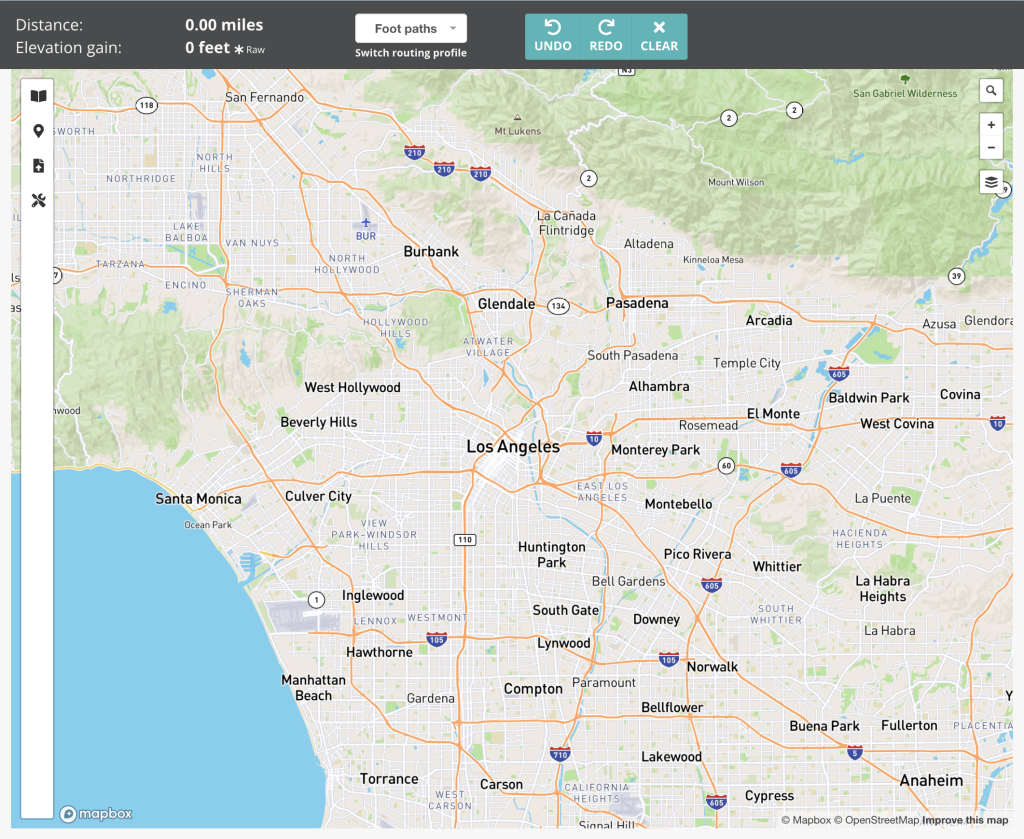
Let’s quickly go through the top toolbar here:

- Distance/Elevation. In the top left you will see values for the cumulative distance and elevation gain of your course. It is currently at zero, but as we build our course you will see these values adjust. One important note here is that the elevation gain value is what we call “raw”, or unprocessed. Once your course is completed this value will be adjusted down. You can click on the *Raw next to the elevation to learn more.
- Switch routing profile. Just to the right of the distance/elevation you’ll see the currently selected routing profile, which is foot paths. The map below allows you to plot point by point to build a course. HelloDrifter uses the OpenStreetMap database to intelligently determine how to traverse from each point that is plotted. With “Foot paths” selected here, the route between each point plotted will be determined based on paths in OpenStreetMap that are accessible by foot. (This would mostly exclude things like freeways or other places without sidewalks or where pedestrians are forbidden.) If you plot a point and it doesn’t provide the expected result, it is often good idea to try a different profile, such as by bike or car. If nothing works, you can switch to the “manual” profile, which allows you to (somewhat tediously) plot freehand without consulting OpenStreetMap.
- Undo/redo/clear. These teal buttons are for resolving mistakes when building your course.
Now we can discuss the map itself.
The left vertical toolbar contains tools to help build your course:
- Quick guide. The top button provides a quick and easy-to-access guide on how to build a course.
- Points of interest. The second button from the top is the point of interest tool. Click this button causes your clicks on the map to open a modal where you can fill out fields to add a point of interest. More on this is discussed below.
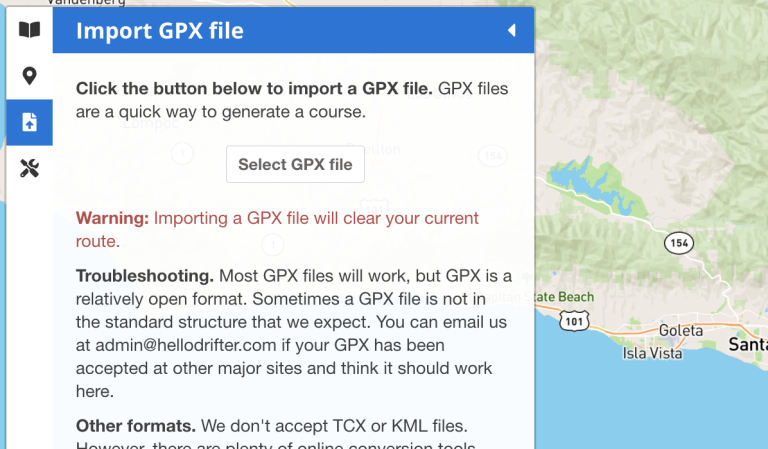
- Upload GPX. This is the fastest way to construct a course. Clicking this button will open a panel that will direct you on how to upload a GPX file.
- Advanced utilities. This includes some convenient tools for once you have your course building skills in order.
The right side of the map contains a few buttons to help you navigate.
- Search. You can always click and drag the map to find where you want to be, but click the magnifying glass allows you to search for places so that you can immediately be redirected to their location.
- Zoom in/out. Self explanatory.
- Layers. This button allows you to switch the map layer used. The editor has three options: default, outdoors, and satellite. Outdoors tends to better show paths in open spaces. Satellite is very useful when OpenStreetMap doesn’t correctly reflect a trail or street.
Plotting your course
Now that we have some of the layout functionality explained, we can start plotting our course!
GPX. The simplest way to get your course up. Click the “upload” icon on the left vertical toolbar and follow the instructions to upload a GPX file.
Click-to-plot. If you don’t have a GPX file handy, you first need to find the starting point of your course. You can either just click-and-drag the map or use the location search button in the top-right of the map. Once you have found your starting location, click your mouse on the map for each point. The map will try to find foot paths to connect each point. You’ll see the distance increment and the map gather elevation data. If the results are awkward or look incorrect, you can undo your last plot with the “undo” button in the toolbar, and then switch your routing profile. If the driving or biking profiles do not work, you can always manually plot (which works, but is more tedious).
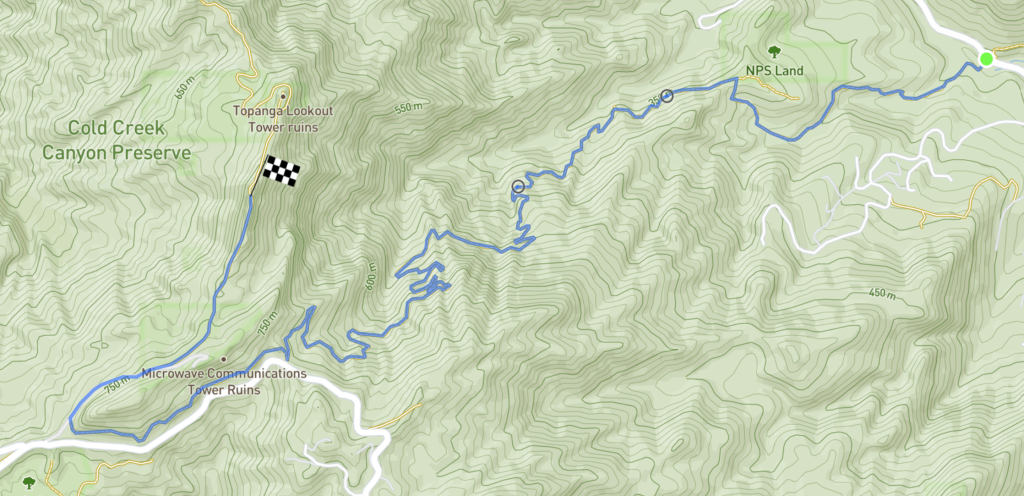
If you find that your course needs adjusting at a previously clicked plot, you can try to change it by dragging one of the “circles” along your course. This will try to adjust your course along a new path, if available. (Remember your current routing profile will apply to this adjustment!)
Adding points of interest
Points of interest can be added by activating the POI button on the left-vertical toolbar.
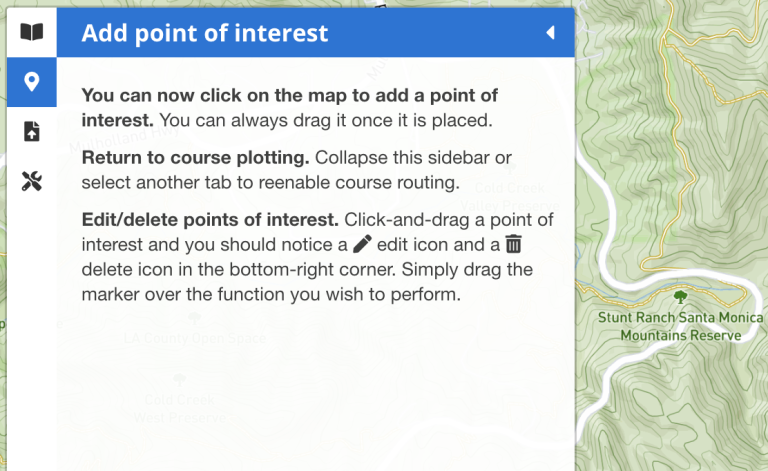
With the POI toolbar now open, clicks on the map will pop up a modal containing vairous options for the point of interest.
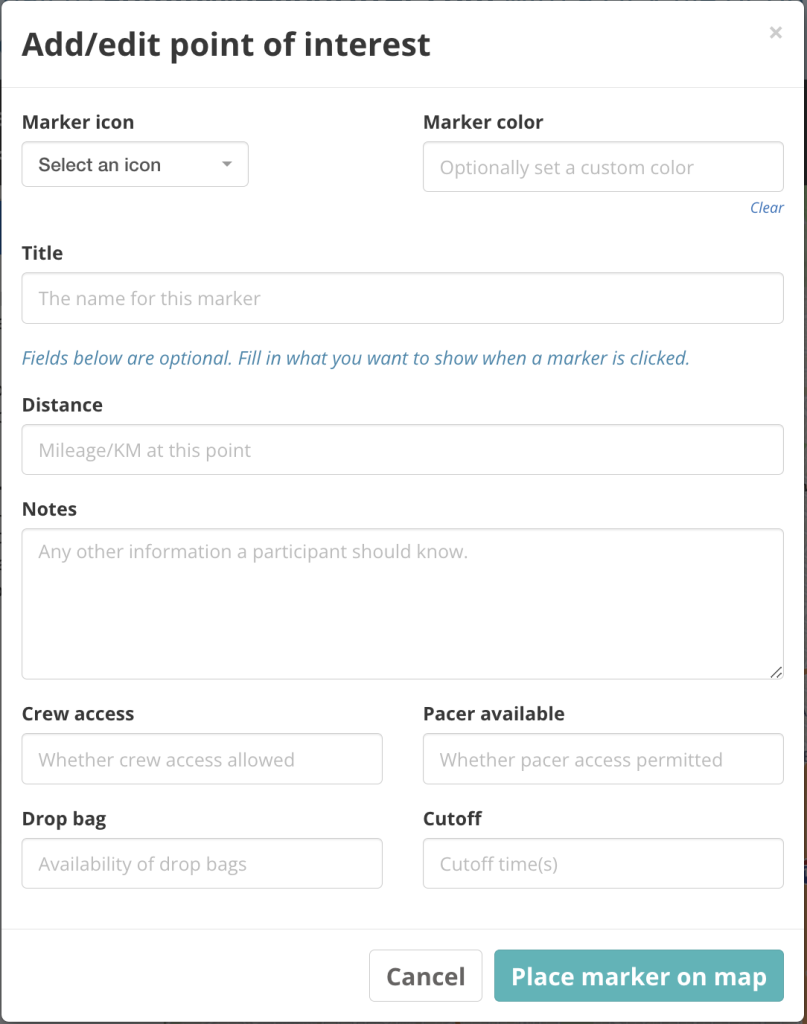
The only required fields are the icon and the title. Every other field is optional and will only be displayed if it contains content.
When the map is saved points of interest are all given a default color depending on the map style (which is edited elsewhere). However, if you want your POI to deviate from a default color, you can optionally select a different color.
When you are finished, the POI should appear as something like this. Click on it to see the details you entered.
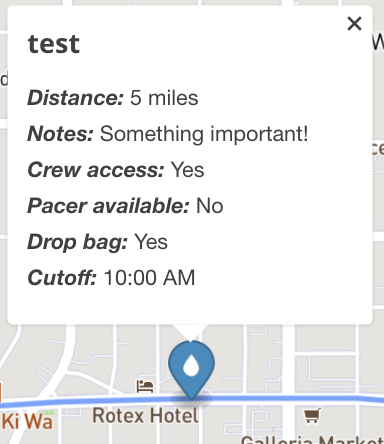
If you want to edit or delete an existing POI, you must click and drag it to the bottom-right side of the map. As you click and drag, an “edit” and a “delete” icon will appear in that corner. Drag the POI to the action you want to apply.
Finishing up
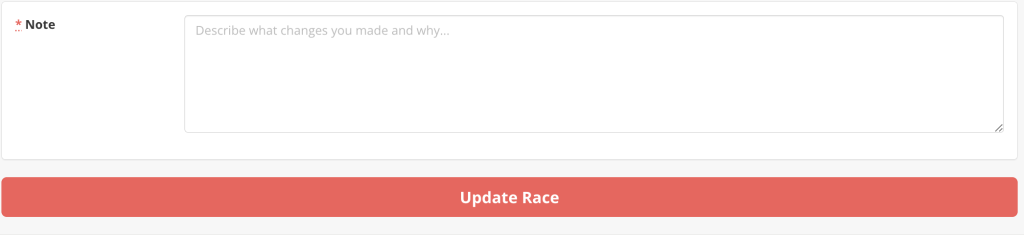
When you are all done plotting your course, you can save your course by clicking the “Update race” button below the map. (You can ignore the “Note” field for now; that is just helpful for people trying to keep track of changes to their race.)
Finalizing your Event
Once you have saved your course, you’ll be redirected back to the event page. It might look something like this:
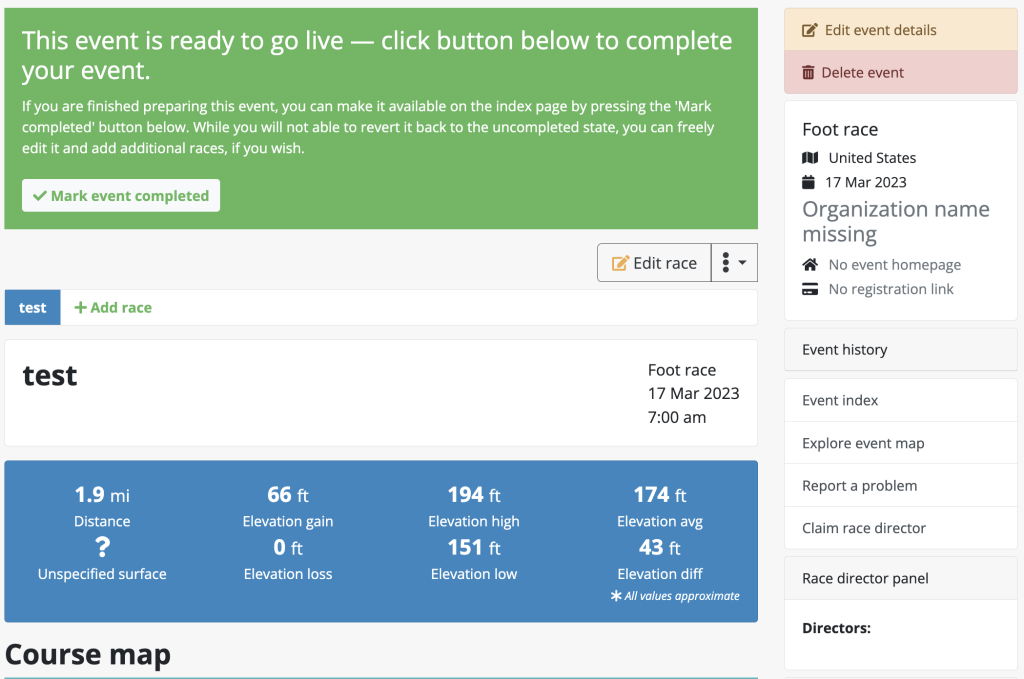
If you would like to add additional races to your event, just click the green “Add race” link and go through the steps above again. If you still have a yellow banner telling you that your Event is not ready, that usually means you have other races that are part of this Event but which don’t have courses plotted for them. You can click to access those other races and plot their courses by clicking on the race’s name next to the “Add race” button.
When you are finished, and want to use this Event as a source for an Embedded Map, click the “Mark event completed” button in the big green space.
Great! You now have a source Event up on HelloDrifter. This is accessible to everyone who might stumble upon it from the Internet. (If for some reason you don’t want it to be public, just let us know.) And as mentioned, we can use it for creating embedded maps.
Race director options
If you are the race director for the event, go and claim it by clicking the “Claim race director” button on the right side of the map (if you are on mobile, this might be below the map). This will bring up a simple form. Once submitted, we will review your request and approve it shortly.
Once you are approved, this means that no one but you can edit the event. That is, unless other people also claim race director status and you approve them. This allows multiple people to manage an event.
Being a race director gives you more interesting options in managing a race. You can access the race director settings page by clicking the “Event actions” dropdown and clicking the appropriate button:

The race director settings page presents two categories of options. The first are event settings, and apply to the entire event:

The “Locked to edits by race directors only” is enabled by default. This ensures that only race directors can edit your event. In the rare event that you would like the HelloDrifter community to contribute edits to your event, you can disable this.
The next option “Automatically recreate this event for next year” simply tells HelloDrifter that once the event’s date has passed, you consent to HelloDrifter checking your website to see if a new date has been chosen. If HelloDrifter detects a new date for the following year, it will recreate the event (and let you know that it did as well).
The final option “Race order” refers to the order that the races appear in the event page. By default, they are ordered by distance in ascending order. But you can change this to descending or to order alphabetically. (If you happen to have a unique way you would like to order, use alphabetically but preface every race name with a number corresponding to the order you want them to appear.)
The second category of options in the director settings page are race settings. There is a block for each race in the event, like this:

The first two options let you manually set the displayed elevation gain and loss for the course. Note, however, that should you ever update the course for the race, these values will be reset and you will need to re-update them.
The last option is to display surface details. This settings toggles whether the map for the race should use surface details information, which is only available if the OpenStreetMap database has the data for the entire race course. This is off by default, as sometimes you can find that it is inaccurate or skews your course in some way. However, it is a very cool presentation of your race and we welcome you to experiment turning it on and off.